
TL;DR: MlxNdPerf is the NVIDIA/Mellanox utility that measures RDMA Read/Write/Send bandwidth and latency between two endpoints. Run it server-side on one node, client-side on the other — a healthy 25 GbE link should report ~23 Gbps; a failing link will show 0 Gbps with CQE with a bad completion status errors.
What it is
MlxNdPerf (ships with the Mellanox WinOF-2 driver) replaces the older Network Direct test suite (nd_write_bw, nd_read_bw, nd_send_bw, etc.). Use it to validate RDMA between two nodes when troubleshooting suspected SMB Direct, Storage Replica, or Live Migration performance issues on Storage Spaces Direct or Azure Local clusters.
The binary is located at:
C:\Program Files\Mellanox\MLX_WinOF2\Performance Tools\MlxNdPerf.exeRecommended action
MlxNdPerf must be run from an elevated Command Prompt (cmd), not PowerShell. If you start in PowerShell, switch to cmd first by typing cmd and pressing Enter — the commands below assume you are in a cmd session.
1. On the server-side node (the RDMA responder — start this first):
cmd
cd "C:\Program Files\Mellanox\MLX_WinOF2\Performance Tools"
MlxNdPerf.exe -Server -Read -SrcIP <local IP> -Duration 30 -NumOfThreads 2
You should see the server enter a listening state and accept connections from the client:
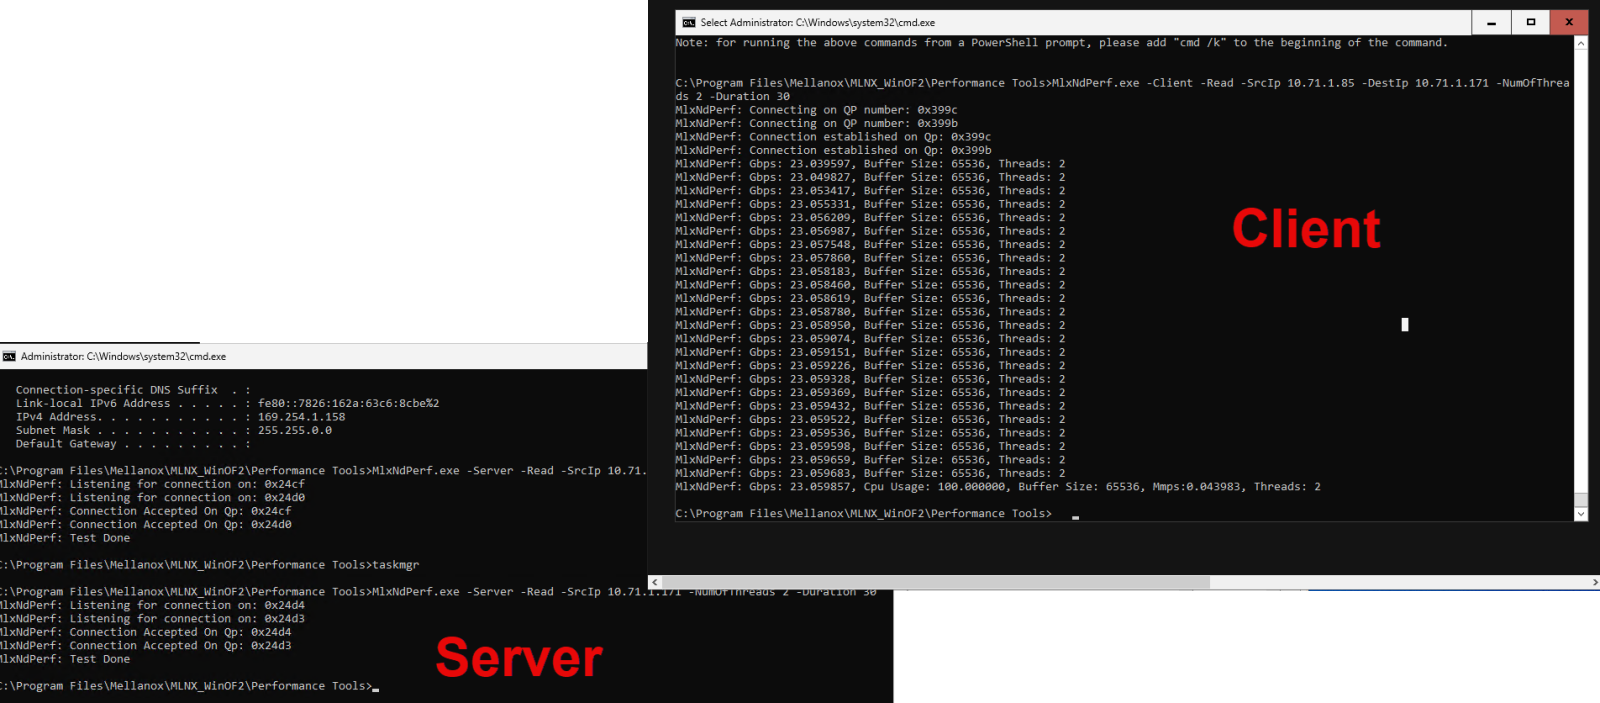
2. On the client-side node (the RDMA requestor — start after the server is listening):
cmd
cd "C:\Program Files\Mellanox\MLX_WinOF2\Performance Tools"
MlxNdPerf.exe -Client -Read -SrcIP <local IP> -DestIP <remote IP> -NumOfThreads 2 -Duration 30
The client will print one line per second showing observed Gbps, buffer size, and thread count. Both sides should show Test Done at the end of the duration.
Running on a production cluster
MlxNdPerf saturates the link under test. On an active production cluster, this means:
- The test will compete with live SMB Direct, Storage Bus Layer, Live Migration, and Storage Replica traffic — results may read low even when the fabric is healthy.
- Active workloads on the cluster may see degraded storage I/O latency or stalled Live Migrations during the test window.
When possible, schedule MlxNdPerf runs during a maintenance window, or pause the node first (Suspend-ClusterNode -Drain) so its workloads move elsewhere before testing. If neither is possible, keep -Duration short (10–15 seconds), test only one node pair at a time, and treat the numbers as a floor — a healthy result is still meaningful, but a low result on a busy cluster doesn't prove RDMA is broken.
How to read the output — healthy link
On a 25 GbE link with RDMA configured correctly, expect throughput in the low-23 Gbps range (this is normal — protocol overhead consumes the difference from 25 Gbps line rate). Per-second readings should be stable, not bouncing between high and low values.

Final line on the client looks like:
MlxNdPerf: Gbps: 23.059857, Cpu Usage: 100.000000, Buffer Size: 65536, Mmps:0.043983, Threads: 2How to read the output — broken link
If RDMA is misconfigured between the endpoints, the connection is established but no work requests can complete. The client reports 0 Gbps for several seconds before failing with a CQE error:


MlxNdPerf: Gbps: 0.000000, Buffer Size: 65536, Threads: 2
ERROR: CQE with a bad completion status= 0xc00000b5.
Zero throughput plus CQE with a bad completion status means the RDMA connection was accepted but the queue pair could not complete work requests. Common causes:
- DCB/PFC mismatch between the two endpoints (run
Get-NetQosTrafficClasson both nodes and compare) - RoCE version mismatch (RoCEv1 vs RoCEv2)
- Switch QoS not configured to honor PFC for the RDMA priority
- Mellanox firmware mismatch between the two adapters
- MTU mismatch on the RDMA-bearing vNIC / pNIC
Going forward
- Always start the server side first — the client will fail to connect otherwise.
- Use the SMB Direct / RoCE IPs of the adapters under test, not the management IPs.
- A passing MlxNdPerf result confirms RDMA is healthy at the transport layer; it does not validate SMB Multichannel or storage performance.
- Re-run after any driver, firmware, or switch QoS change — prefer a maintenance window or drained node, since production workloads share the same fabric.
Optional details
Other useful flags:
-Write/-Send— test Write or Send operations instead of Read-Latency— measure latency instead of bandwidth (requires-BufferSize; not compatible with-NumOfThreads,-UseEvents,-QueueDepth, or-Resilient)-ReadEx/-WriteEx/-SendExwith-NumOfQps— multi-QP test (both sides must use the same-NumOfQps; runs single-threaded)-BufferSize <bytes>— bytes per Send/Write/Read post (default 65536)-QueueDepth <n>— entries in the QP and CQ-UseEvents— event-notification mode for the CQ instead of polling-Resilient— survives adapter status changes; not available for Server in Send mode-ReportPeriod <n>— interval between intermediate prints (0 disables)-Verbose 1— extra diagnostic output
Full reference: NVIDIA WinOF-2 Fabric Performance Utilities documentation