
TL;DR: An application write in a VM on Azure Local traverses ten or more layers — guest filesystem, VHDX, CSV, ReFS, Storage Spaces, the Storage Bus Layer over RDMA, and finally NVMe on multiple nodes — before the guest sees write completion. Understanding these layers is the foundation for diagnosing storage performance.
The storage stack:
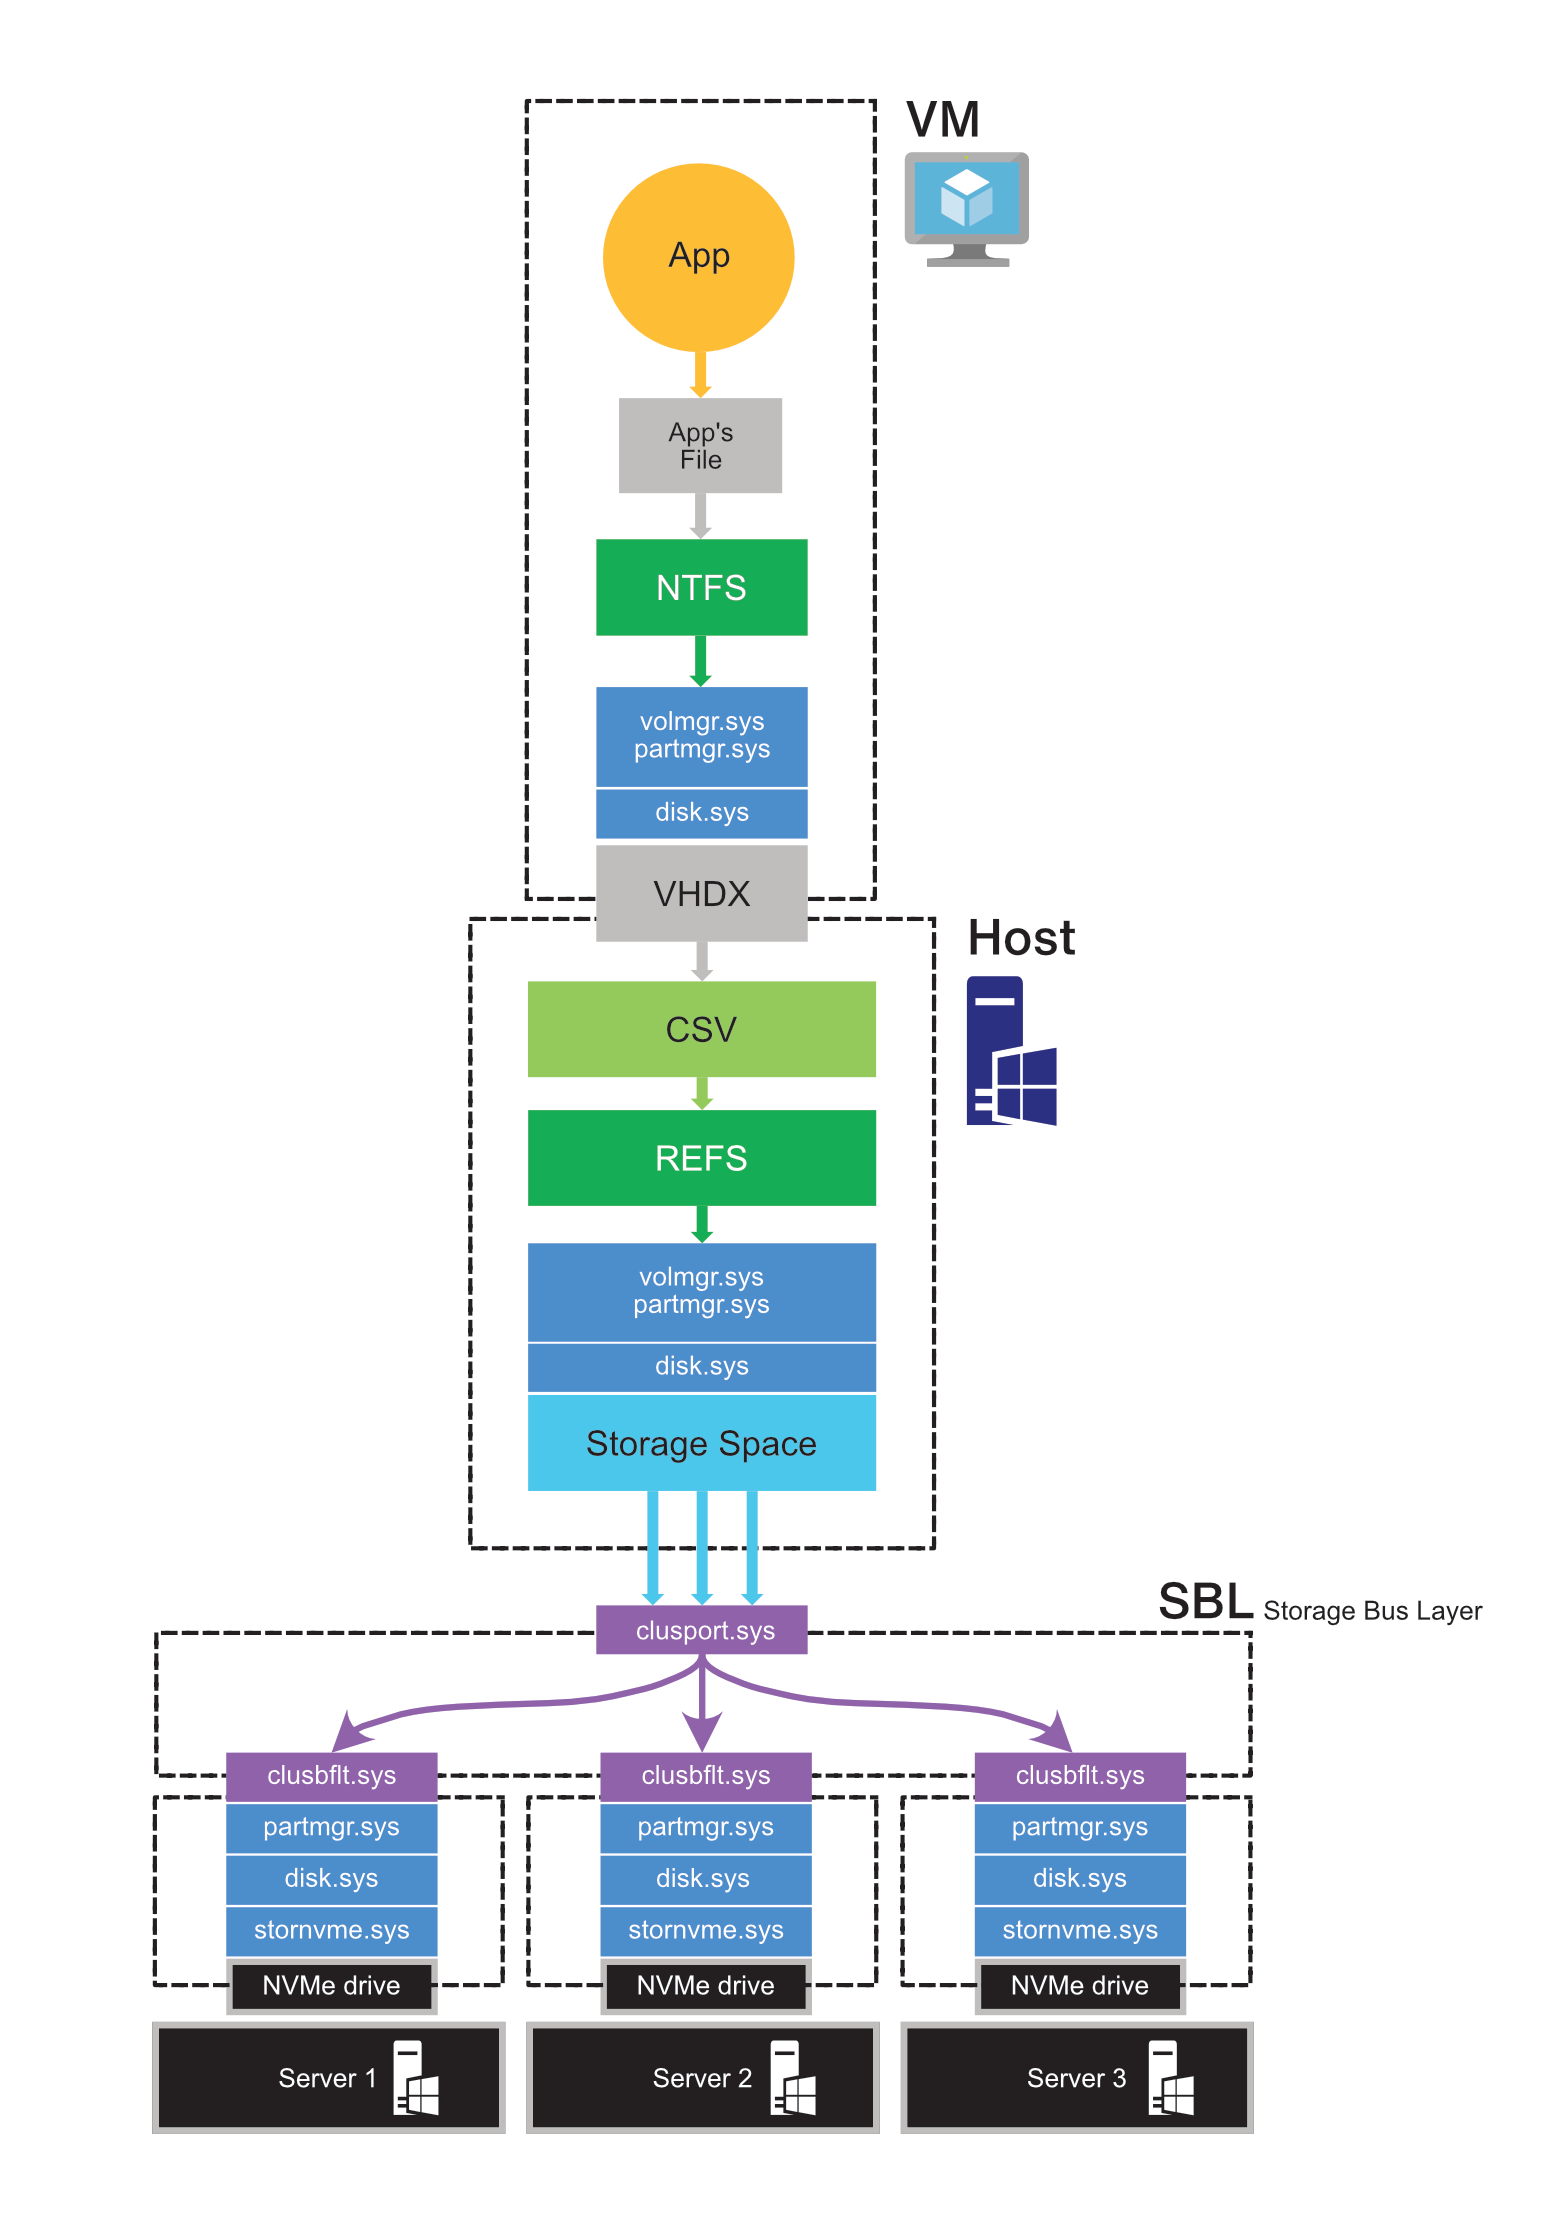
Walkthrough — following a write from app to flash:
Inside the VM:
The application issues a write to its file.
NTFS in the guest receives the write and translates it to block I/O.
The guest storage stack (volmgr.sys, partmgr.sys, disk.sys) hands the I/O to the synthetic SCSI controller, which writes to the VHDX file on the host.
On the host:
The VHDX lives on a Cluster Shared Volume (CSV). CSV is the cluster-visible abstraction that lets every node access the same volume.
Underneath CSV, ReFS is the actual filesystem on the virtual disk. ReFS handles metadata, integrity streams (if enabled), and block allocation.
Below ReFS, the host storage stack (volmgr/partmgr/disk.sys) hands the I/O to Storage Spaces. Storage Spaces is where the resiliency policy lives — 2-way mirror, 3-way mirror, nested resiliency, or parity. It decides which physical extents on which nodes need to receive a copy of this write.
Across the Storage Bus Layer (SBL):
clusport.sys (the SBL initiator) issues writes to clusbflt.sys (the SBL target) on each node that holds a copy. This hop traverses the storage network using SMB Direct over RDMA. For a 3-way mirror, this means three concurrent network operations to three different nodes.
On each target node, the write descends through disk.sys and stornvme.sys to the physical NVMe drive.
Every copy must be acknowledged before the guest sees write completion. The slowest node defines the write latency.
Why this matters for performance:
Three takeaways follow directly from the diagram:
1. Writes always traverse the network. Even if the VM runs on a node that holds one of the mirror copies, the other copies live on different nodes and must be acknowledged over the storage fabric. There is no “local write” optimization that avoids the network hop entirely.
2. Reads can be local; writes cannot. Storage Spaces can serve a read from any copy, so reads can be satisfied locally if the VM is co-located with a copy. This is why same-node vs. cross-node placement affects read latency but has little impact on write latency.
3. The slowest layer wins. With ten-plus layers in the path, a problem in any one of them caps the performance of the whole stack. A misbehaving NIC, a stale RDMA configuration, a failing drive, or a busy ReFS metadata operation can all become the bottleneck.
Common troubleshooting layers:
When write latency is materially higher than expected (for an all-flash cluster, healthy 4K random write p50 is typically 0.3–0.8 ms with p99 under 2 ms), the issue usually lives at one of these layers:
Network / SBL (steps 7–8): RDMA falling back to TCP, or DCB/PFC misconfigured causing pause storms. Check:
Get-SmbClientNetworkInterface
Get-NetAdapterRdma
Get-NetQosPolicy
Storage Spaces (step 6): Background repair or resync consuming SBL bandwidth. Check:
Get-StorageJob
Get-VirtualDisk | Get-StorageJob
Physical devices (step 8): Mixed device types in the pool, or a single slow/failing drive setting the floor on every mirror write. Check:
Get-PhysicalDisk | Sort-Object HealthStatus, OperationalStatus
Get-StorageReliabilityCounter -PhysicalDisk (Get-PhysicalDisk)
Above ReFS (steps 4–5): BitLocker on the CSV without hardware offload, or aggressive ReFS integrity streams on a hot workload.
Optional details:
The Storage Bus Layer is the component most people don’t see in casual documentation but is the heart of S2D performance. It presents physical drives across all nodes as if they were locally attached to every node, using SMB Direct as the transport. When SBL is healthy, drive access across the cluster behaves like a single large pool. When SBL is unhealthy (RDMA issues, congestion, MTU mismatch), every write operation in the cluster suffers — even reads from the same node can be impacted by SBL backpressure.
For deeper investigation, Get-ClusterPerf and the Cluster Performance History feature in Azure Local expose per-layer counters that map closely to the stack above — volume IOPS, vDisk latency, physical disk latency, and SBL transport health.